
The platform
Analyse a site. Compare design options.
Run wind, thermal comfort, sun and daylight analyses. Read the result on the map, inspect a building, and compare design options.
Run a workflow, get a report
A workflow answers one question with several analyses at once, for example Heat Island, Year-Round Public Space Design or Natural Ventilation Potential. You get the combined result on the map, the key takeaways with what to do now, in the next cycle and in the long term, and a report you can share.
Choose the Engineering or Stakeholder report voice for the intended reader. Check the site, assumptions and price before you run. Single analyses remain available in the same catalogue.
Choose a site and its data
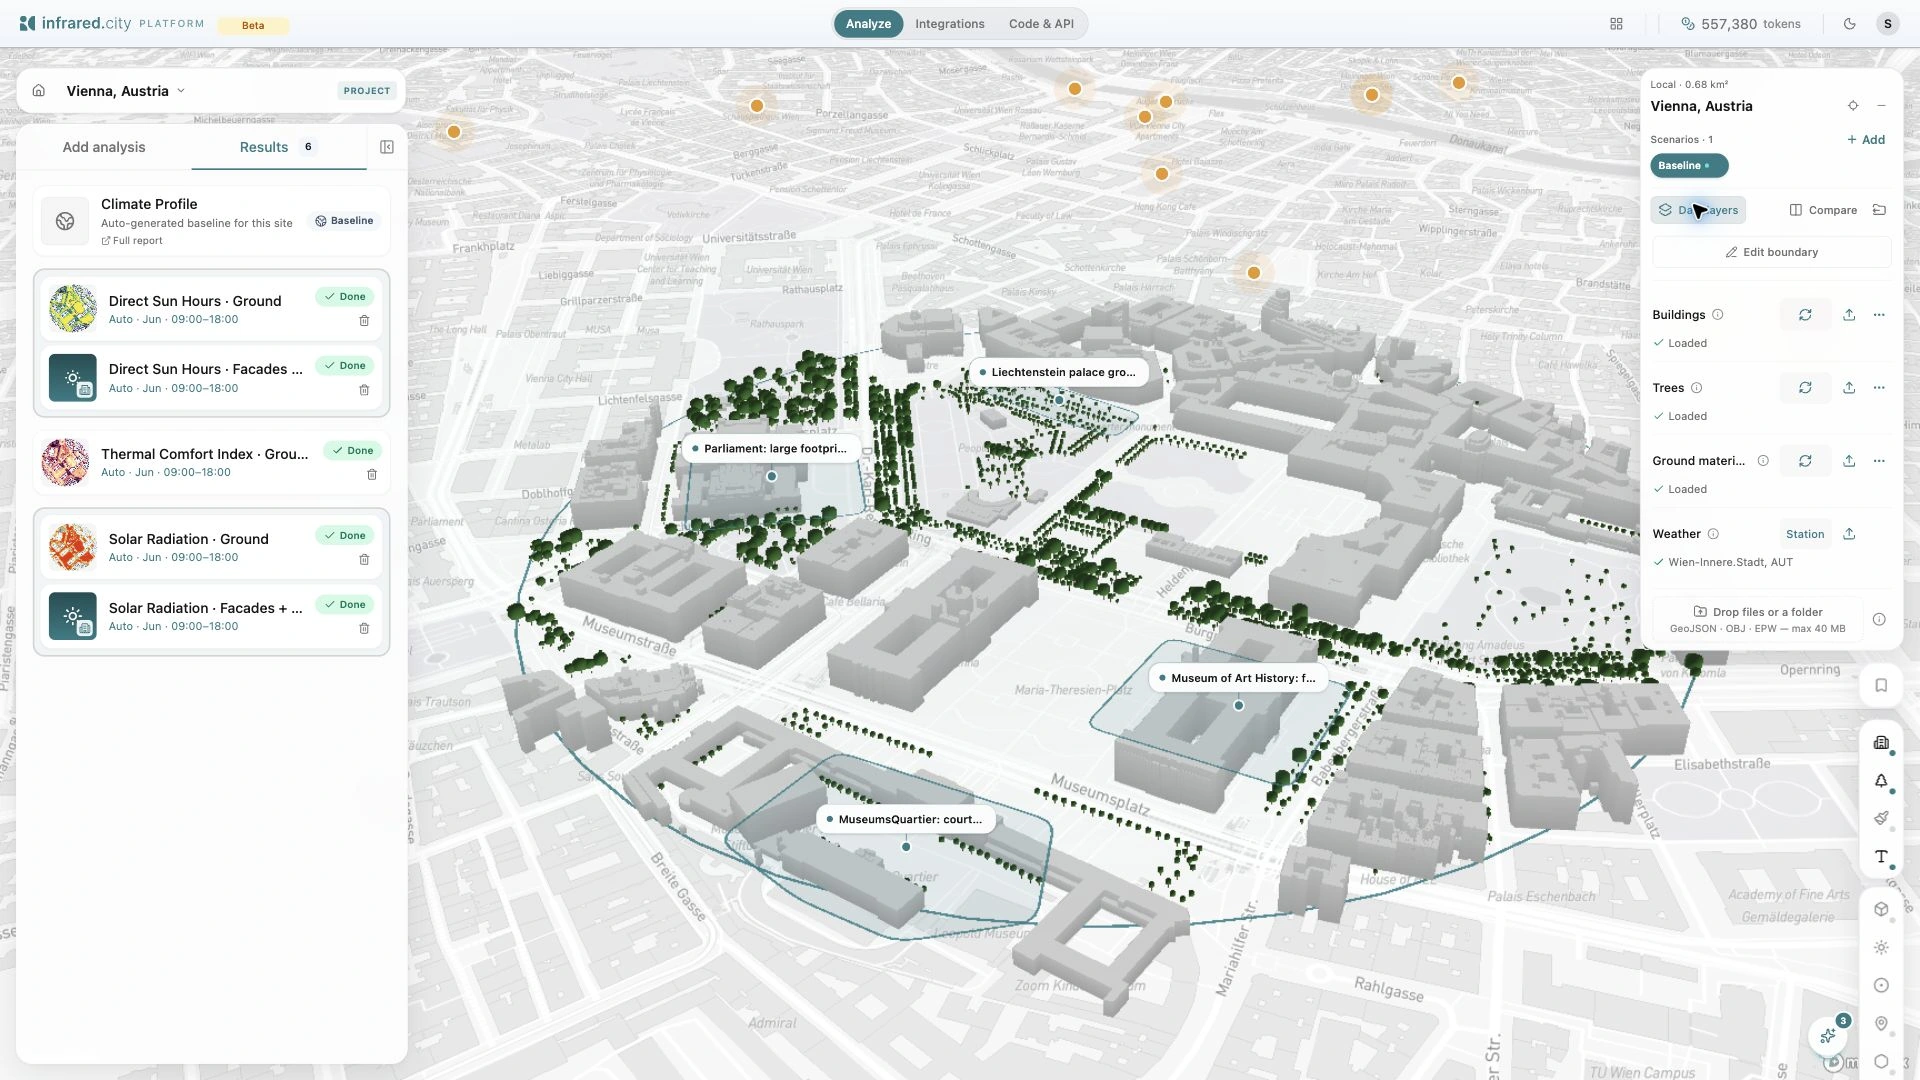
Search for a place and draw its boundary. Open Data layers to review the buildings, trees, ground materials and weather source. Upload your own design geometry or climate file where needed.
Check the geometry placement and the analysis period before you run. The analysis cart shows the run target and token price.
Inspect the sun path and shadows
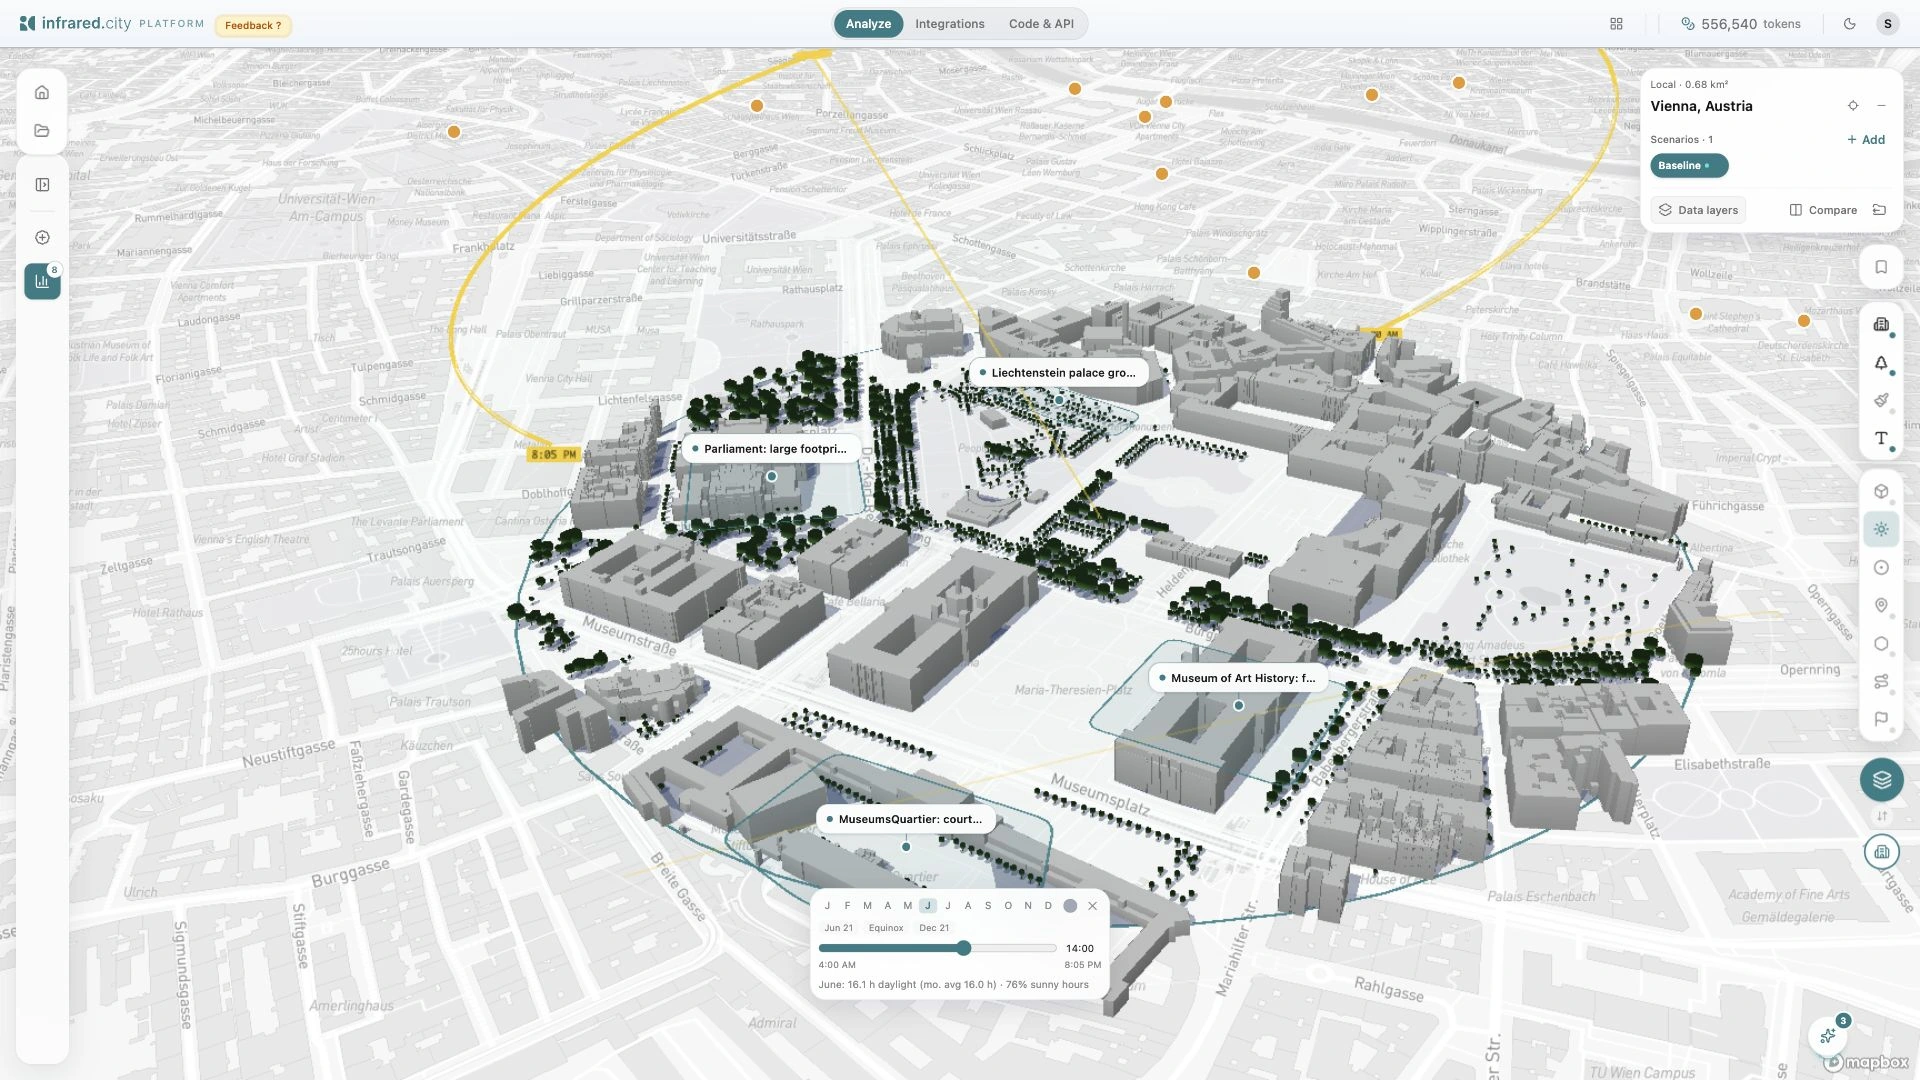
Choose a month and time in Sun & shadows. See which streets and courtyards fall into shade. Use this view to choose the period for a saved sun-hours or solar-radiation analysis.
Read pedestrian wind comfort
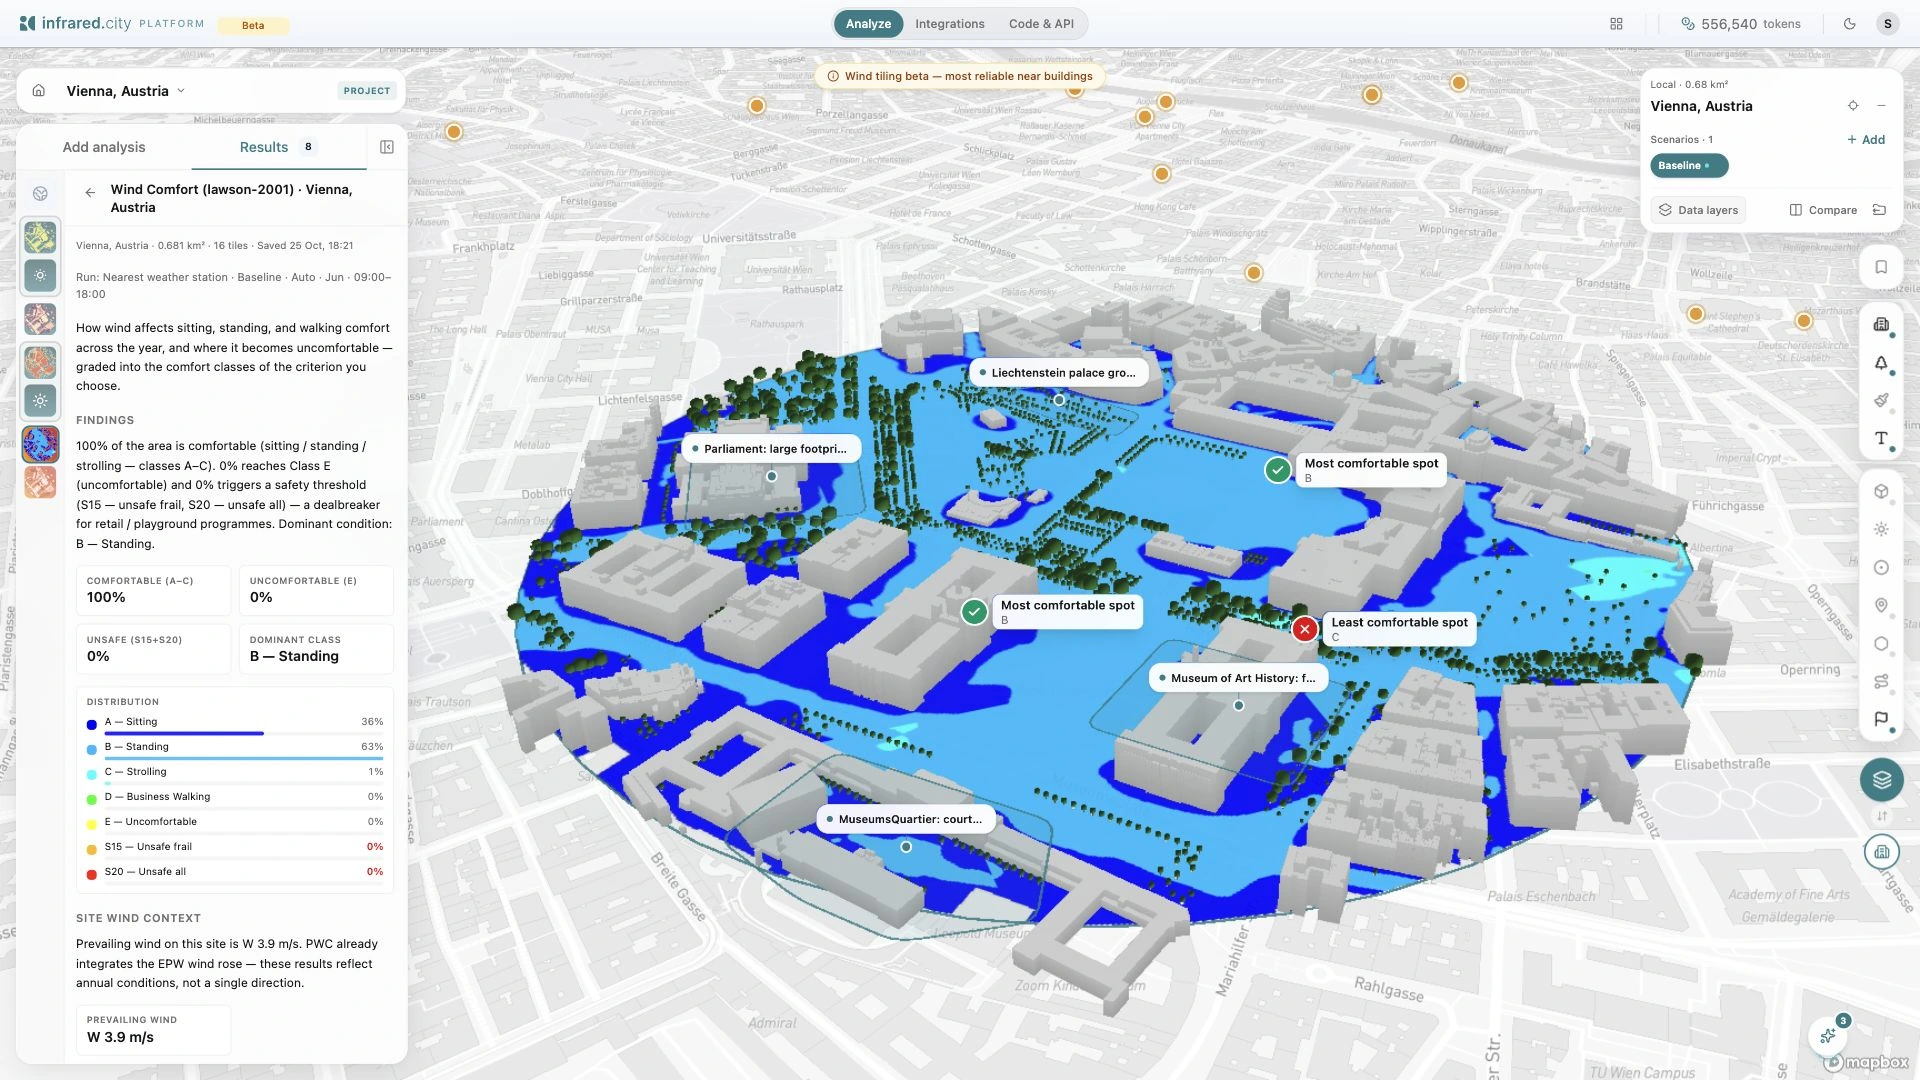
Open a completed result to see the map, distribution and run settings. This Vienna example shows pedestrian wind comfort with the Lawson 2001 criterion. Inspect the places where people sit, wait and walk.
Read facade and roof values
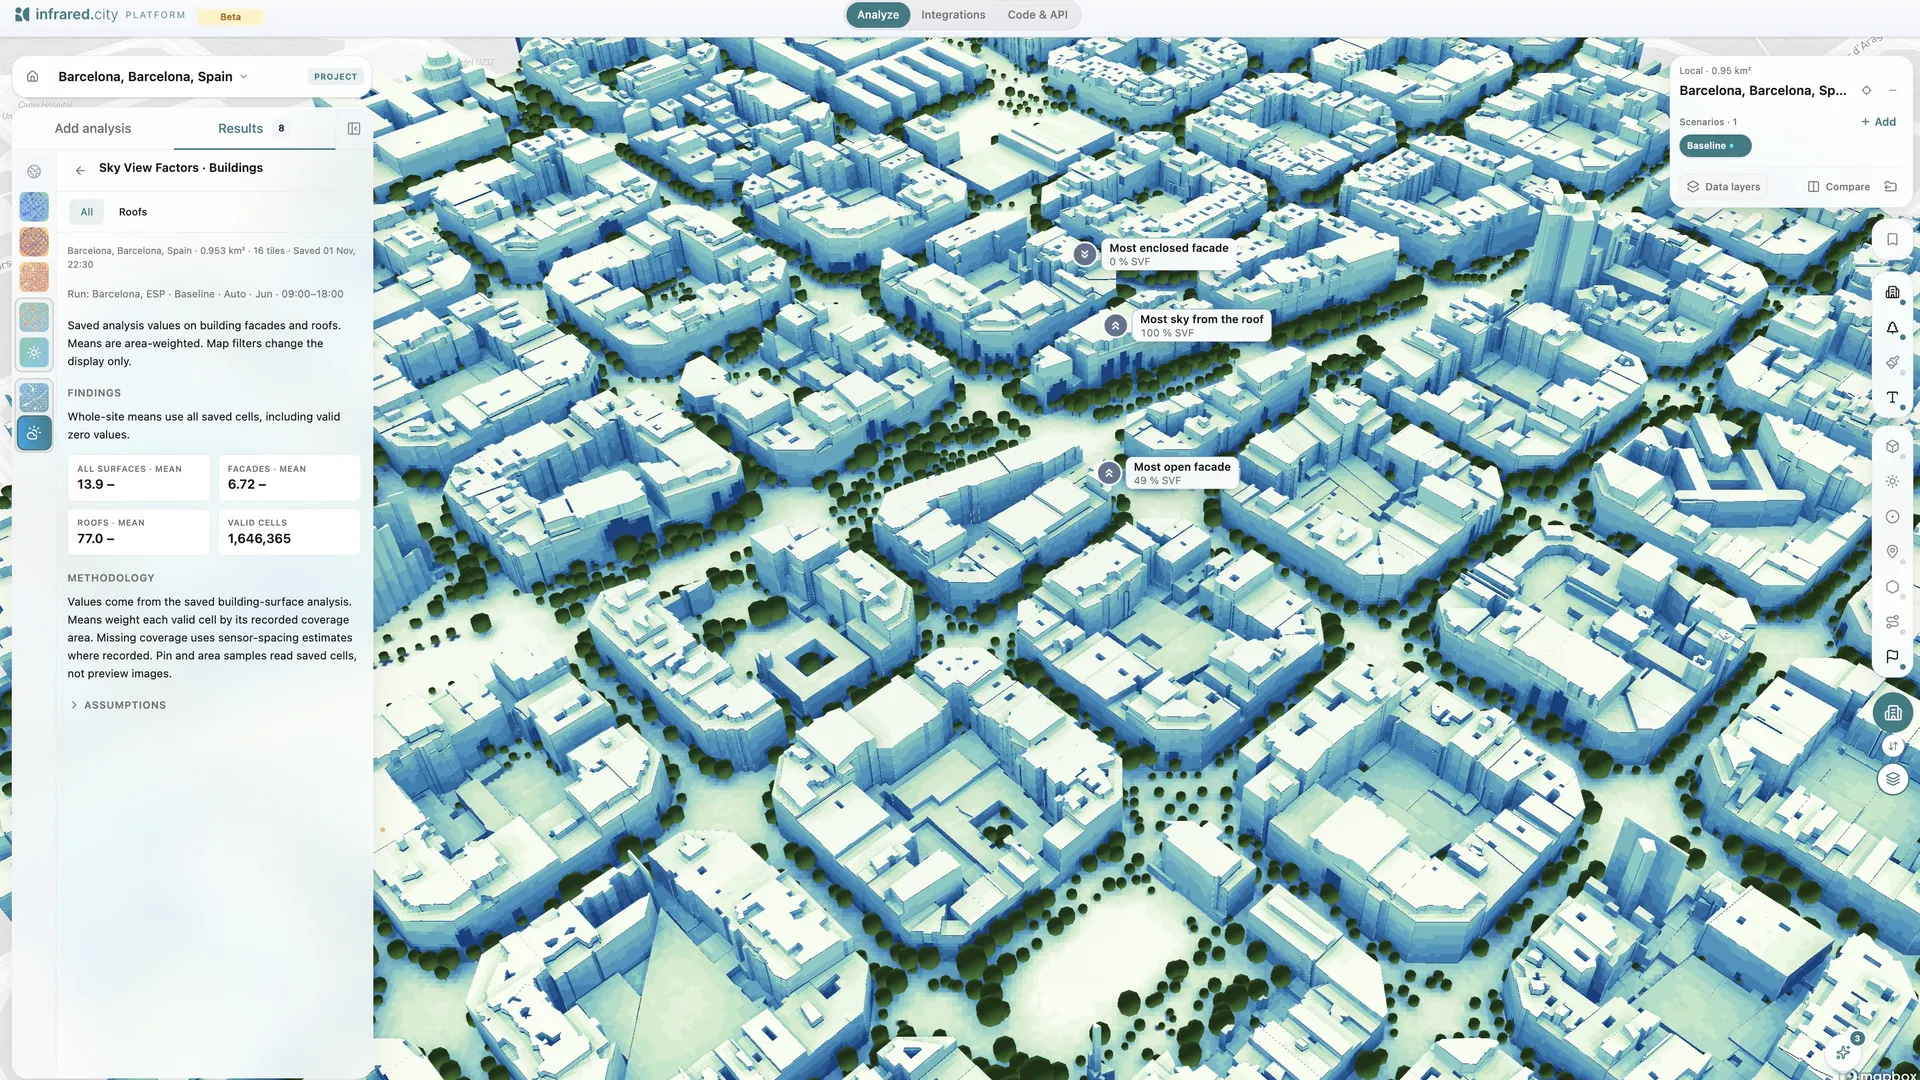
Open a building result to read the facade mean, the roof mean and the values on every surface. This Barcelona example shows sky view factor, with pins on the most enclosed facade, the most open facade and the roof with the most sky. Switch between All and Roofs to inspect the surface group you need.
Compare design scenarios
Keep the weather, period and analysis settings the same for each design. Compare the maps side by side, or read the results in a table.
Select a saved area to inspect the same place in each option. Use Total, Δ or % to read values and changes against the baseline.
Ask for the surfaces you need
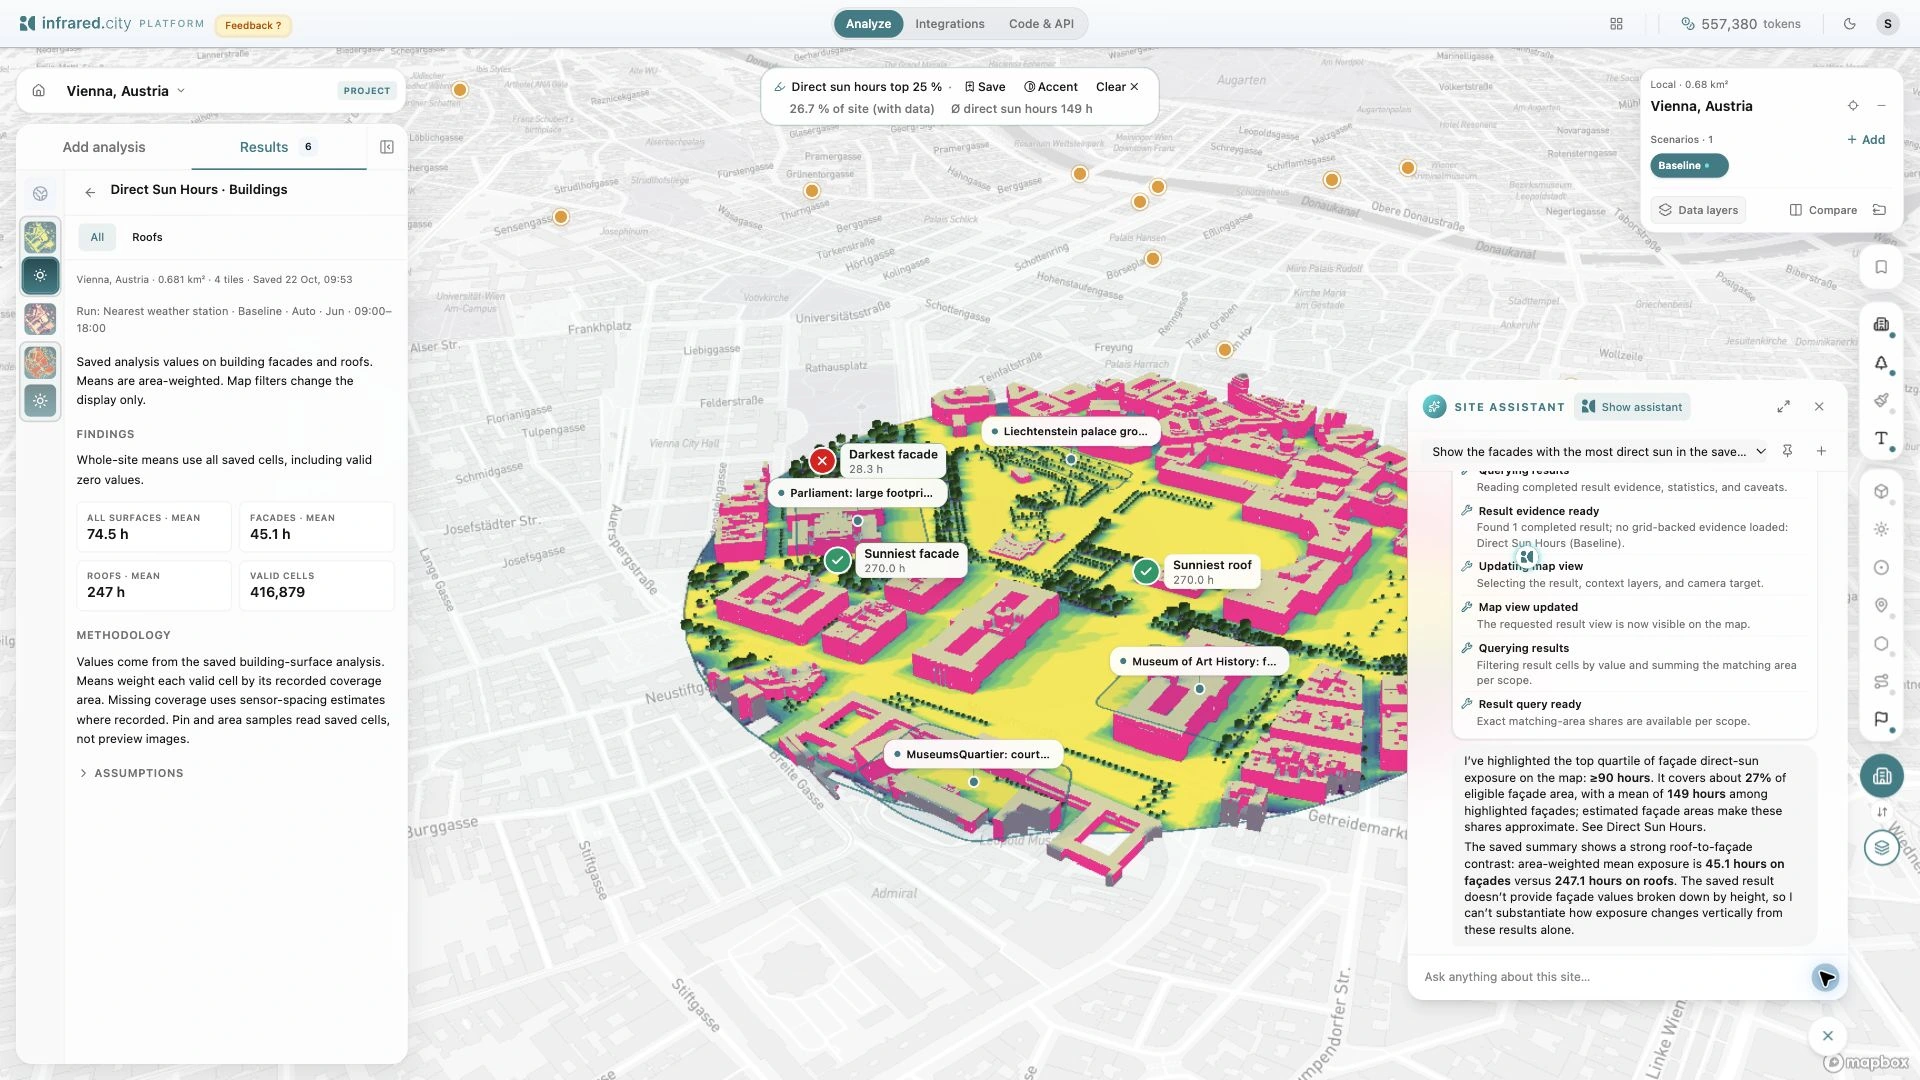
Ask the Site Assistant to find facades with the most direct sun. It reads the saved result and highlights matching surfaces on the map. Check its steps, answer and stated limits beside the result.